
Drewry World Container Index Leaps 9% on Tightening Transpacific, Asia-Europe Capacity
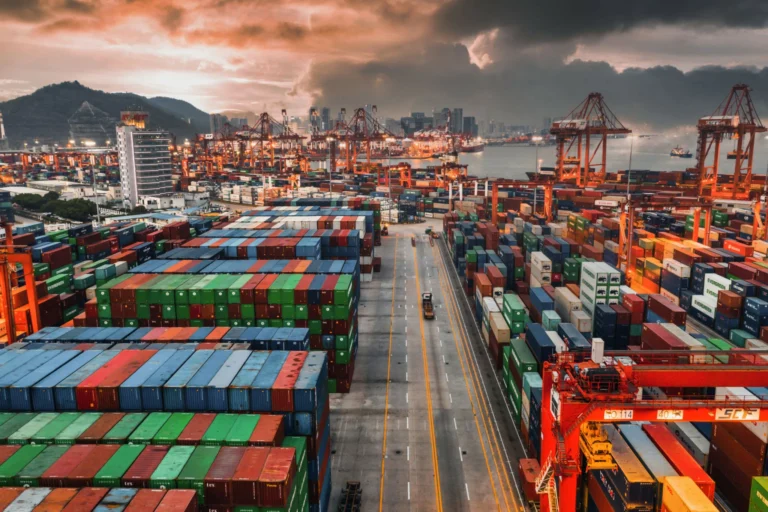
Global container spot rates surged 9% this week, according to the latest assessment from Drewry, as cited by shipping publication gCaptain, amid capacity constraints and robust seasonal demand on the transpacific and Asia-Europe trades.
Transpacific Rates Climb on Vessel Withdrawals
Carriers serving the transpacific lane have withdrawn a notable number of sailings in recent weeks, a move that directly constrains available slots and drives spot prices higher. The timing coincides with the lead-up to peak shipping season, when retailers in North America stock up for back-to-school and holiday sales. With fewer ships in rotation, even moderate cargo volumes can cause equipment imbalances and booking pressures.
Drewry’s assessment indicates that the transpacific eastbound route saw some of the sharpest increases. Shippers moving goods from Asian manufacturing hubs to the U.S. West Coast are now contending with rates that have doubled compared to the same period last year. The capacity management strategy, known as blank sailings, has become a favored tool for carriers aiming to maintain revenue levels amid fluctuating demand. The current capacity situation on the transpacific is reminiscent of earlier supply crunches, though carriers argue that blank sailings are a response to less-than-robust demand forecasts. However, shippers counter that the aggressive blank sailings are unnecessary and inflate prices artificially. Drewry’s cancellation tracker shows that blank sailings between Asia and North America have risen by around 15% compared to the previous month, further squeezing capacity.
Asia-Europe Trade Grapples with Lengthy Detours
On the Asia-Europe corridor, the situation is further complicated by the ongoing rerouting of vessels away from the Red Sea. The conflict-related disruptions have forced ships to take the longer Cape of Good Hope route, adding up to two weeks to transit times and effectively absorbing a significant amount of fleet capacity. This structural shift has tightened supply even as European importers scramble to secure goods ahead of the summer.
The extra sailing distance has not only pushed up spot rates but also increased bunker fuel consumption and operational costs. As a result, carriers have implemented a series of surcharges, compounding the base rate hikes. Market participants note that the current level of uncertainty makes it challenging for forwarders to offer fixed-price contracts, leaving many shippers exposed to spot market volatility. Drewry’s East-West Index shows that rates for a 40-foot container from Shanghai to Rotterdam have climbed sharply, with some lanes recording double-digit percentage increases in a single week. The added transit time also means that containers are tied up longer, reducing the effective capacity of the fleet. Analysts estimate that the Red Sea diversions have absorbed between 5% and 10% of global container shipping capacity, though the exact figure is difficult to isolate due to overlapping schedule changes.
Industry Context: Capacity Levers and Rate Benchmarks
The Drewry World Container Index (WCI), a composite of spot rates on eight major east-west trades, serves as a key benchmark for the industry. Its 9% week-on-week jump is one of the largest single-week movements this year, underscoring the fragility of current supply-demand dynamics. Shipping analysts highlight that global container fleet capacity has grown by roughly 10% year-on-year, yet operational factors such as port congestion and rerouting have neutralized much of that increase.
For logistics managers monitoring freight rates from China, the latest figures are a stark reminder of how quickly costs can escalate. Importers on the China to Europe sea freight rates lane, for instance, are seeing the direct impact of both blank sailings and the Red Sea bypass. Carriers typically plan their blank sailing programs several months in advance, but the volatility has led to more ad-hoc cancellations, making forecasting even harder.
The WCI reading now stands well above the pre-pandemic average, though it remains below the record highs of 2021-2022. Still, the rapid ascent raises concerns about inflation and the cost of consumer goods. Stakeholders from retailers to manufacturers are being forced to reassess their supply chain budgets, with many exploring alternatives such as air freight for high-value or time-sensitive shipments.
Shippers and freight forwarders are now closely watching whether the upward trend will persist through the third quarter. Much depends on carrier decisions regarding capacity in the coming weeks and the duration of the Red Sea disruption. Any easing of geopolitical tensions could quickly release capacity and cool rates, but for now, the market remains on edge. The dramatic rate swings are likely to intensify calls for greater contract transparency and may accelerate the shift towards longer-term fixed-rate agreements as a hedge against spot market volatility.
Key Figures
This story reports a measured change such as 9%. Figures like this show direction and scale, so it helps to keep them separate from the surrounding commentary.
- Rate increase: 9% Week-on-week rise in Drewry's global container spot rate composite, driven by capacity constraints on key trades.
Why This Matters
The sharp rise in spot rates signals that despite a fleet expansion, supply chains remain vulnerable to disruption. For shippers, volatile pricing undermines budget planning and squeezes margins, potentially feeding consumer inflation if sustained. Carriers' aggressive capacity management and geopolitical risks are reshaping traditional trade patterns.
FAQ
Who published the 9% container spot rate increase?
The data was published by Drewry, a leading maritime research and consulting firm, through its World Container Index (WCI). The index tracks spot rates on eight major east-west trade routes and is a widely cited benchmark in the shipping industry.
What are the main factors behind the rate surge?
The primary drivers are a combination of significant capacity tightening—through carrier blank sailings—and robust seasonal demand. On the Asia-Europe lane, ongoing Red Sea diversions have further absorbed capacity by forcing ships onto longer routes.
Which trade routes are most affected?
The sharpest increases have been observed on the transpacific route from Asia to North America and the Asia-Europe corridor. Both lanes are experiencing acute capacity shortages, leading to elevated spot prices and operational surcharges.
What is the outlook for container freight rates?
Market insight suggests that rates could remain elevated through the third quarter if carriers continue blank sailings and the Red Sea disruptions persist. Any resolution of geopolitical tensions or a pullback in demand could release capacity and cool rates, but uncertainty remains high.
Sources
Source: gCaptain