
Shippers Risk Supply Chain Resilience in Pursuit of Lower Freight Rates
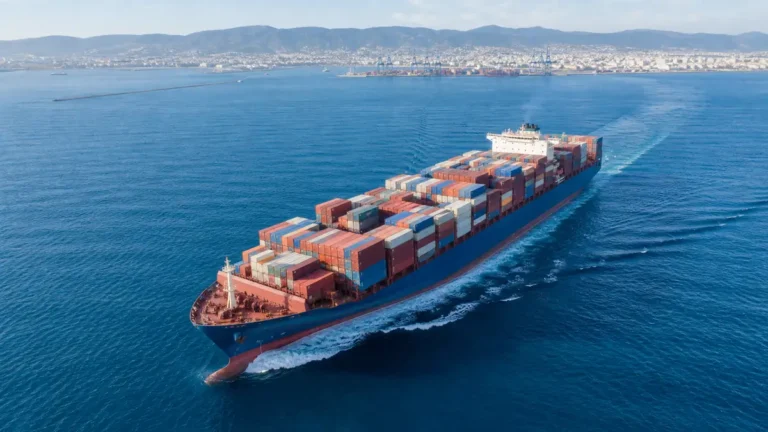
The relentless drive to secure the cheapest possible ocean freight might be quietly eroding supply chain stability, according to a recent analysis from Splash247. The commentary challenges an industry norm that has long equated procurement success with rock-bottom container rates, questioning whether short-term savings are being prioritised over the structural health of global logistics networks. As container shipping markets continue to oscillate between overcapacity and tight space, the debate exposes a critical fault line between transactional cost management and strategic supply chain design.
The Rate Trap
Logistics procurement teams have traditionally been measured by their ability to drive down freight spend—a metric that is tangible, immediate, and easy to report. In everyday operations, managers spend considerable time comparing freight rates from China to major consumer markets, often using digital brokerage platforms to find the lowest spot quotes. This behaviour was amplified during the pandemic-era rate spikes, when securing space at any price became a survival tactic, but the habit has persisted even as market conditions softened.
Splash247’s commentary points out that this singular focus on unit cost can blind shippers to the total cost of ownership (TCO). When inventory carrying charges, production line stoppages, demurrage fees, and lost sales due to empty shelves are factored in, the real price of choosing an unreliable carrier on rate alone often dwarfs the invoice savings. The mismatch between procurement incentives and supply chain resilience has never been starker.
Data Reveals Reliability Trade-offs
Global schedule reliability figures lend weight to the argument. According to Sea-Intelligence, the average on-time performance of container vessels fell below 35% during the most disruptive quarters of 2021–2022, a dramatic slide from around 75% pre-pandemic. While reliability has partially recovered, it remains well short of historical norms, and the volatility itself has forced inventory planners to hold more safety stock—tying up working capital and warehouse space.
These numbers illustrate the hidden tax of rate-centric decision-making. Carriers that consistently offer the lowest freight rates often do so by cutting corners on schedule integrity, cancelling sailings (blank sailings) when demand shifts, or overbooking to maximise utilisation. Shippers who chase those rates without evaluating historical performance metrics expose their supply chains to unpredictable lead time variability. The total logistics cost equation, meanwhile, includes less visible line items: expedited air freight when ocean cargo misses the connection, production downtime, and contractual penalties from downstream customers.
Beyond the Ocean Freight Invoice
Progressive logistics organisations are now moving away from siloed freight rate negotiation toward integrated supply chain modelling. Instead of evaluating bids purely on a US$ per forty-foot equivalent unit (FEU) basis, they are incorporating lane-level reliability scores, transit time guarantees, and the availability of alternative routings into their carrier selection frameworks. This shift is being enabled by greater data transparency and digital twins that can simulate the impact of a two-day delay on a retail promotion.
The industry is also seeing a resurgence of interest in longer-term contracted rates—despite their premium over spot—precisely because they offer guaranteed space and equipment availability. In a market where the global fleet is facing decarbonisation-driven retrofits and the uncertainties of Red Sea diversions, the capacity assurance that comes with a contract may be worth more than a few hundred dollars saved on a spot booking.
| Aspect | Rate-First Approach | Supply Chain-Centric Approach |
|---|---|---|
| Primary objective | Minimise ocean freight spend | Optimise total landed cost and service |
| Key metrics | Spot rate, BAF, surcharges | On-time delivery, inventory days, total cost per unit |
| Carrier selection | Lowest bidder wins | Balanced scorecard including reliability |
| Typical contract type | Short-term or spot | Mid- to long-term, with service commitments |
| Long-term risk | Higher disruption exposure, hidden costs | Higher unit freight cost, but lower risk |
The conversation, as Splash247 suggests, is beginning to turn. More chief supply chain officers are asking whether the savings from a low-cost carrier are real when they trigger air freight surcharges to cover late arrivals. Technology platforms that layer predictive analytics over ocean freight data are giving shippers the means to model total cost scenarios, rather than simply comparing rates. As these tools become mainstream, the industry may finally escape the rate trap.
Key Figures
This story includes concrete figures such as below 35%. The points below pull out the key numbers so the reporting is easier to scan and verify.
- Schedule reliability dip: below 35% during peak disruption, down from around 75% pre-pandemic, per Sea-Intelligence data
Why This Matters
The debate signals a potential inflection point in procurement strategy. For decades, logistics managers have been measured primarily on freight spend reduction, but persistent supply chain disruptions are proving that unit cost savings can be dwarfed by the hidden expenses of unreliable transit. A broader adoption of TCO frameworks could reshape carrier selection, contract structures, and even how industry performance is benchmarked.
FAQ
Who raised the concern about freight rate optimisation overshadowing supply chain resilience?
The commentary was published by Splash247, a shipping news outlet, which questioned whether an overwhelming focus on ocean freight rates has undermined supply chain stability. The analysis highlights how procurement incentives often reward cost savings without accounting for reliability or total logistical impact.
What does focusing solely on freight rates mean for shippers?
Shippers risk increased supply chain disruptions, including longer and less predictable lead times, higher inventory carrying costs, and a greater likelihood of stockouts. Hidden expenses such as demurrage, expedited air freight, and contractual penalties can quickly erase the initial savings from a low rate.
How has schedule reliability changed during recent disruptions?
Global container vessel schedule reliability fell below 35% at the height of the COVID-era disruptions, compared with around 75% before the pandemic, according to Sea-Intelligence. While figures have improved, reliability remains below pre-pandemic norms, adding to supply chain uncertainty.
What is the alternative to rate-only optimisation?
Industry leaders are adopting total cost of ownership (TCO) models that evaluate not only the freight rate but also transit time reliability, inventory impact, and service consistency. This approach is supported by digital twins, predictive analytics, and a shift toward longer-term contracts with performance guarantees.
Sources
- Splash247 (splash247.com)
- Sea-Intelligence (sea-intelligence.com)
Source: Splash247